Python example for Climatic Research Unit (CRU) time-series (TS)
CRU TS data
The following guide will assist with the manipulation and visualisation of the Climatic Research Unit (CRU) gridded time-series (TS) dataset. For more information on this data, or to understand the ways in which it can be downloaded, please click here CRU data user guide.
The following analysis is done using the data in a netCDF format (.nc) and by running a Python script (.py) to produce 2 different plots, this will require the data to be downloaded in this specific format. The two plots that will be created are:
- Annual mean temperature (1901-2017) - Global map
- Global average temperature anomaly (1901-2017) - Time series plot
The easiest way to download the data in this format to your local files is by accessing it here:
http://data.ceda.ac.uk/badc/cru/data/cru_ts/cru_ts_4.02/data/
Then select your parameter (the following script is specific to temperature "tmp") and the 1901-2017 netCDF file (cru_ts4.02.1901.2017.tmp.dat.nc.gz)
The python script is available to download here.
If you are a JASMIN user, the script is located at /badc/cru/software/plot_cru-ts_examples.py, run it with the existing file path, as it is set to the location of the CRU TS data on JASMIN. This script is compatible with Python 3, to use this on JASMIN, load a Python 3 environment by typing 'module load jaspy' before your Python command.
The data is located on JASMIN in the following directory: /badc/cru/data/cru_ts/cru_ts_4.02/data/
If you would like to explore data analysis of CRU in Jupyter Notebooks or the JASMIN Notebook Service, you can find it here: https://github.com/cedadev/ceda-notebooks/tree/master/notebooks/data-notebooks/observations/cru
Python data visualisation example
The following will give a brief explanation of what each part of the code does in this script and may suggest ways in which this can be modified to adapt to different scenarios:
The code below is put at the beginning of the script to add the specific packages (tools) that are needed in python to achieve the outcome.
import numpy as np
import matplotlib.pyplot as plt
from netCDF4 import Dataset
from  mpl_toolkits.basemap import Basemap
This code reads in the data to the program so it can be viewed, manipulated and displayed as required. The text within the quotation marks is the file path. This will need to be changed to the specific location of where the data is saved.
filename = "/badc/cru/data/cru_ts/cru_ts_4.02/data/tmp/cru_ts4.02.1901.2017.tmp.dat.nc"
data = Dataset(filename)
print(data.variables.keys())
- 'lat' for latitudes
- 'lon' for longitudes
- 'time' for time
- 'tmp' for near surface temperature
Next, the temperature variable is set. This allows the temperature data to be used within the script. If another parameter is required from the data, that variable should be selected.
temp = data.variables['tmp'][:]
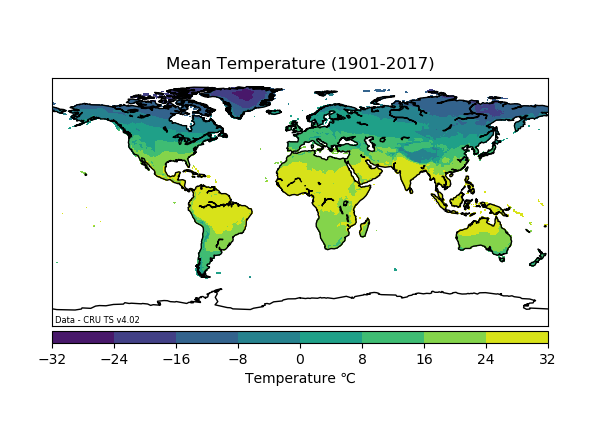
Plot 1 - Global Map
The temperature variable that has been set as 'temp' in the code above, is a function of latitude, longitude and time as it is 3-dimensional. To produce a map plot, the temperature values need to be averaged across the entire time period of the dataset. This will give 1 average value per grid point. The line below averages the temperature variable by the time axis.
temp_av_1901_2017= np.mean(temp[:,:,:],axis = 0)
Now the gridded average has been calculated, the following code shows how a map can be plotted with this data. This example plot is for the globe. To create a regional map, change the llcrnrlat, llcrnrlon, urcrnrlat and urcrnrlon which are the lat/lon values of the lower left and upper right corners of the map.The Basemap module is used here to create a map plot. For help using Basemap click here.
- Basemap(projection="cyl", resolution='c', llcrnrlat=-90, urcrnrlat=90, llcrnrlon=-180, urcrnrlon=180) sets the Basemap settings. To set up the desired Basemap, the projection, resolution, latitude and longitude extent needs to be defined. The latitude and longitude extent determine what area will be shown on the map (this example is global)
- 'cmap=plt.cm.viridis' is the colour used to display the data, this can be changed by amending the last word. For colour options, see here
- 'temp_av_1901_2017' is the data which we defined in the code above
- plt.title("text") defines the title which will go on the map plot, this can be changed depending on the parameter being plotted
- cb= map.colorbar(im1,"bottom",size="5%",pad="2%", extend='both') creates a colour bar scale for the map
- cb.set_label(u"Temperature \u2103") adds a label for the colour bar, this can be changed dependent on the parameter being plotted (adding u before the quote marks and \u2103 within the quote marks adds the symbol for degrees Celsius)
-
plt.savefig("text.png") is the name and format the map image will be saved as. This can be changed.
plt.figure()
map = Basemap(projection="cyl", resolution='c', llcrnrlat=-90, urcrnrlat=90, llcrnrlon=-180, urcrnrlon=180)
map.drawcoastlines(color="black")
lons,lats = np.meshgrid(data.variables['lon'][:], data.variables['lat'][:])
x,y = map(lons, lats)
temp_plot = map.contourf(x, y, temp_av_1901_2017, cmap=plt.cm.viridis)
cb = map.colorbar(temp_plot, "bottom", size="5%", pad="2%", extend = 'both')
cb.set_label(u"Temperature \u2103")
plt.title("Mean Temperature (1901-2017)")
plt.annotate('Data - CRU TS v4.02',(-178,-88), fontsize=6)
plt.show()
plt.savefig("cruts_global.png")
This code will produce a global map as shown below:
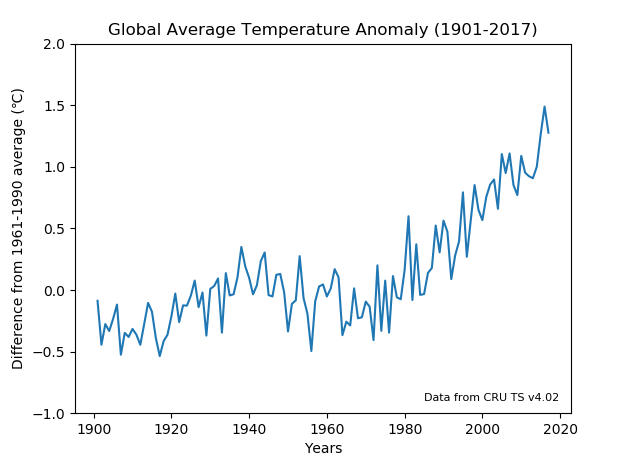
Plot 2 - Time series
For the time series graph, the data needs to be averaged in a different way. To create a time series plot, the data needs to be averaged across all grid points, so there is 1 global value vs time. The line of code below does exactly this. NOTE: This script does not account for the 'pole problem' eg. no changes have been made to the weighting of the polar regions grid spacing, hence the values in this graph may appear slightly higher than reported in other CRU graphs (this graphs max is nearly 1.5 degrees).
global_average= np.mean(temp[:,:,:],axis=(1,2))
To reduce the seasonal noise in this time series graph, an annual average needs to be calculated from the monthly data. The code below reshapes the global average into [117,12] as there are 117 years in the dataset, each with 12 months. Then the average is calculated for each year. These new annual average values are saved as 'annual_temp'.
annual_temp = np.mean(np.reshape(global_average, (117,12)), axis = 1)
For this plot, it is useful to look at the temperature values as an anomaly to a certain temperature period. The following code calculates the annual temperature anomaly in comparison to the average temperature in 1961-1990. The first line calculates the average temperature value for this time period (1961-1990). This is done by slicing the data with the indices 60:89 as this gives the values from 1961-1990, then averaging these values. The second line then deducts the average temperature value between 1961-1990 from each of the annual temperature values calculated above, saving it as 'temp_anomaly'.
av_1961_1990=np.mean(annual_temp[60:89])

temp_anomaly = annual_temp - av_1961_1990
The following code plots a time series graph. The anomaly data calculated above is plotted against time, in years.
- plt.ylim sets a limit for the y-axis so the data can be viewed more clearly
- plt.title displays a title on the plot, this can be changed depending on the parameter being plotted
- plt.ylabel displays a label for the y-axis, in this case it is temperature that is being displayed but this can be changed depending on the parameter being plotted
- The last line is the name and format the graph will be saved as. This can be changed.
plt.figure()
plt.plot(np.arange(1901,2018,1),temp_anomaly)
plt.ylim(np.floor(min(temp_anomaly)), np.ceil(max(temp_anomaly)))
plt.title("Global Average Temperature Anomaly (1901-2017)")
plt.xlabel("Years")
plt.ylabel(u"Difference from 1961-1990 average (\u2103)")
plt.text(1985, -0.9, "Data from CRU TS v4.02", fontsize=8)
plt.show()
plt.savefig('temp_anom_ts.png')
This code will produce a time series graph as shown below: